At SEFE’s recent .NET in London event – a meet up that saw .NET enthusiasts converge on our London office to discuss upcoming trends in technology – and our Development Team Leads Colin Dunn and Stewart Ridgeway were both on hand to lead some of the talks that took place that day.
For anyone who didn’t risk braving the rain that day, we’re bringing you their insights and highlights of their talk for you below: a look at how SEFE’s market modelling has grown over time – specifically its evolution from small on-desk solutions to a fully parallelised model that covers the entire European gas market.
Why market modelling matters
Market modelling – the use of quantitative analysis to simulate how different factors interact in real-world markets – matters to the IT team at SEFE greatly.
“Market analysts use it to understand and predict market changes,” says Colin, “for example, the likes of historical data, behavioural assumptions and externally provided forecasts (including the weather) can all be taken, and then have a model applied to them in order to better understand market dynamics and forecast trends”.
The results from these models can then be used to guide our pricing strategies.
What affects the energy market?
Understanding and forecasting price movements are vital since commodity prices are highly volatile. And because energy markets are so sensitive to internal and external factors, price fluctuations and market shifts can be significant.
Stewart notes, “This kind of sensitivity means that energy markets are affected by everything from geopolitical events to changes in weather patterns”.
Take the 1973 oil crisis, for example. When the US backed Israel during the Yom Kippur War, OPEC initiated an embargo against Western nations. “This unprecedented move caused a supply disruption that saw oil prices quadruple from $3 a barrel to £12 a barrel. Energy prices rose, inflation grew and economies across the West were impacted,” notes Colin. The actions of OPEC underlined just how vulnerable large parts of the world become when they rely on one region for energy supplies.
Of course, we’re seeing something similar with the ongoing conflict in Ukraine. Previously, much of the EU’s gas supply came from Russian pipelines. Now that this route is no longer available, alternative supplies need to be sourced, much of it by LNG, and supplied by ship.
“Since global supply and demand drives the commodities markets, modelling can help us to understand which regions are producing more, consuming more and storing more of a particular commodity,” notes Stewart. And all of this massively helps when it comes to predicting potential supply shortages.
Where forecasting price movements are concerned, modelling can help to align market behaviours with trends in the energy landscape. Colin states, “In the early 2000s, solar energy was far more expensive than other energy sources”. Based on data from technological advancements, research investments and the growth of manufacturing capacities, forecasters predicted significant reductions in the cost of solar panel components.
Colin continues, “As these forecasts became accepted, they also shaped investor sentiment, which in turn increased investments in solar energy projects over the years. The accurate price forecasting created through modelling meant more pragmatic, more data-driven strategic planning for businesses looking to leverage solar energy”.
Market modelling also helps to manage risks. “Let’s say a retail customer wants to reduce the impact caused by volatile prices,” Stewart says, “modelling can be used to provide long term, fixed price contracts”.
We saw what can happen when this isn’t used recently, when a number of retail companies across the UK collapsed, including the energy firm Bulb. “When wholesale gas prices rose dramatically, these companies could no longer source the energy they had sold long term contracts for,” says Stewart. Put simply, their risk management had not taken these scenarios into account, and lacked the processes and strategy to combat the effects of rising gas prices.
There are also trade relations and tariffs, infrastructure and logistics, current strength and climate policies to weigh up too. In early 2020, oil prices were already under pressure due to a slowing global economy and concerns over oil demand. March 2020, saw a disagreement between two major oil-producingnations led to what Colin and Stewart called “an all-out price war”.
“Russia refused to reduce oil production”, continues Colin. “That could have potentially stabilised prices, and so Saudi Arabia announced that it would increase its oil production, causing an oversupply in the global market”.
The timing couldn’t have been worse. As the pandemic gripped the world, there was a dramatic drop in demand for oil. “With airlines grounded, fewer cars on the roads, and industries at a standstill, the world’s appetite for oil shrunk dramatically”, says Stewart.
“This led to a historic drop in oil prices. In April that year, US oil futures even turned negative for the first time. Essentially, producers were effectively paying buyers to take the oil off their hands”.
A broader look at how markets are modelled
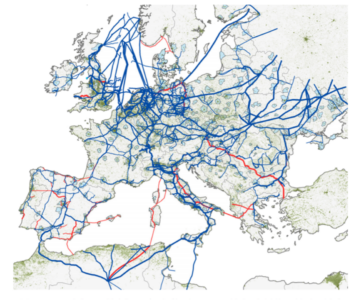
Wherethe modelling of the supply and consumption of gas across a certain network is concerned, where each country has its own balanced network along with imports and exports modelled, there are a few things to consider.

“Since not all gas is the same,” says Colin, “the modelling has to take into account things like the gas’ transportation and calorific value, as well as maintenance schedules, seasonal business demand, residential demand, weather and even national holidays”.
Then there are the technical skills of energy analysts to factor in too. “These vary a great deal,” Stewart says, “so a variety of technology stacks have to be used to perform the modelling”.
For this reason, the use of Excel is very widespread. Colin says, “Along with normal formula usage, we also have embedded queries, we make use of external spreadsheet references, shared spreadsheets and VBA – which can be a bit of a headache.”
“And since there can be a disconnect between the sourcing of certain data items and their usage in models, SQL has pretty much become mandatory for our gas analysts”.
SEFE’s market modelling: What we used to do
“At SEFE we are primarily Microsoft focused and most of our software development is built upon a .NET and SQL Server. This provides a very reasonable trade-off between software development and maintenance costs, ease of use and hiring development resources,” says Stewart.
The increased use of Python in data science means there’s been an increase in Python usage with modelling for both data retrieval and the modelling itself. Colin notes, “We didn’t want the increased use of Python to just become another Excel. We needed a platform which could be used for specific modelling requirements alongside our existing stack”.
There were problems, however. Each morning, before the Traders begin, they need to create a market view of the European energy markets. The team’s previous methods led to what Stewart calls “essentially Excel hell”.
Things were too complex, and a spreadsheet lacked the requirements to reshape models in real time. Things needed to change.
How our market modelling has evolved
“Before we even started to have a look at the spreadsheet problem,” Stewart says, “we investigated a Python solution called Cerebro. Using this, we found that Python wasn’t working too well for workflows, especially where things like multi-threading were concerned. However, it also showed that Python was good for mathematical models written by analysts”.
The message was clear: Use the right language for the right problem.
So in dealing with the spreadsheet issue, the team didn’t want to solve every issue at the same time. “At SEFE we are primarily Microsoft focused and most of our software development is built upon a .NET and SQL Server,” Colin notes, “this provides a very reasonable trade-off between software development and maintenance costs, ease of use and hiring development resources”. This has led to the team learning that using VSTO to offload processing to .NET working well – but it underpinned the need to support multiple requests.
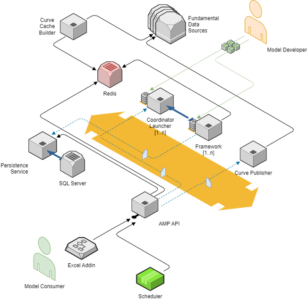
Right now, the team’s current .NET implementation is as follows:
- An Excel add-in
- An API which sits in front of the eventing and “engine” components of the platform
- A scheduling service for batching capabilities, such as for any automation or scheduled jobs that the team needs to do
- A service bus which handles all the model requests and status notifications of the job request
- A co-ordinator used for orchestrating and communicating with the other “engine” components to ensure the requesting job is working

Colin adds, “One thing we noticed quite early on is that when we executed a model, it took time to load the data from various financial market data sources. We also saw that during an initial evaluation using metrics via our ELK stack, the data acquisition alone was taking up to 70% of the total time of executing the model end to end.”
“To solve this, we needed to get this data loaded ahead of any model requests, and then also partially treat the data for various permutations”. These hypothetical permutations could be something like:
- Model 1: I want data given to me aggregated hourly
- Model 2: I want data aggregated monthly
Pre-treating was a case of using an in-memory cache store called Redis, so that when a model request comes through, it would instantly have that data available to use. It also allows the team to request a date range, giving models the flexibility to choose not just the unit of measure, but how much data is needed by date range.
“What’s more, Redis has a neat little feature that avoids data loss in the event it goes down,” explains Stewart. And to ensure further certainty, the team built a “persistence service” which captured the model results and persisted them to a traditional SQL server.
And to deal with issues around logging – specifically things like how to view logs of a model that has travelled through all the team’s components – the SEFE analysts used their Common .NET library. Through this, they could unify distributed logs in conjunction with the ELK stack to correlate those and logs with a singular identifier. Colin says,“Because of this, we’re able to rapidly implement a unifying logging pattern and track the logs of a model. It’s really neat stuff!”
SEFE ’s current AMP platform in figures
“In our current AMP platform, there are some numbers that we feel are well worth sharing”, says Stewart. These are as follows:
- SEFE currently computes over one million models every morning and throughout the day. To do this manually, we’d need to hire tens, if not hundreds of market analysts just to carry out
- At any one time, the team processes ~15GB of financial market data in real time, taking only 3-5% of the total model execution run time. In other words, the team receives new data every second from hundreds of market sources, with a volume of ~15GB
- The team’s AMP platform now processes data from 20,000 unique timeseries data items – and each of these goes back as far as 2003, so they have 20 years of data to work with.
We hope you’ve enjoyed this behind-the-scenes glimpse into the way we model markets at SEFE. A huge thanks to Colin and Stewart for their insights. For the latest IT and analyst job vacancies, head to our page here.


