Study: How has work ethic changed over the years?
Everyone has a different idea of how they should behave in the workplace, from the willingness to pick up extra shifts to voluntarily picking up more responsibility. In an era of so-called “quiet quitting”, the idea of changing our professional behaviours has never been more prominent. But how does work ethic differ based on our age? And how do different people feel about topics relating to work ethic?
Our study reveals all about how work ethic plays into different age groups and why there could be major differences.
Our study
Over the years, workplaces have experienced significant changes, including the shift to remote work during the 2020 pandemic. As a result, the values and motivations of many employees have also changed. To better understand people’s perspectives on work ethic and professional behaviour based on their age group, we conducted a survey covering topics such as overtime, motivation, and workload. By analysing the responses, we could begin to uncover how working attitudes have evolved over time and gain insight into some of the reasons behind these changes.
The key findings
The study revealed interesting trends in the attitudes and behaviours of employees across different age groups. For instance, the majority of our findings conclude that older workers have more of a traditional work ethic compared to younger people in the workforce.
However, this doesn’t necessarily mean that the younger generations don’t care about their work and careers. In fact, our results suggest the opposite for many young workers. Below we’ll take you through a summary of the responses to each question in our survey.
How has work ethic changed over the years: survey responses
How long have you been in employment?
In our survey, we asked about our participants’ duration of employment. The majority (24%) reported that they had been employed for 31 to 40 years. This information provides us with a solid foundation for comparison, enabling us to comprehend how attitudes and work ethics have evolved over time and their current state.
Have you ever picked up extra shifts at work? (When asked or of your own accord)
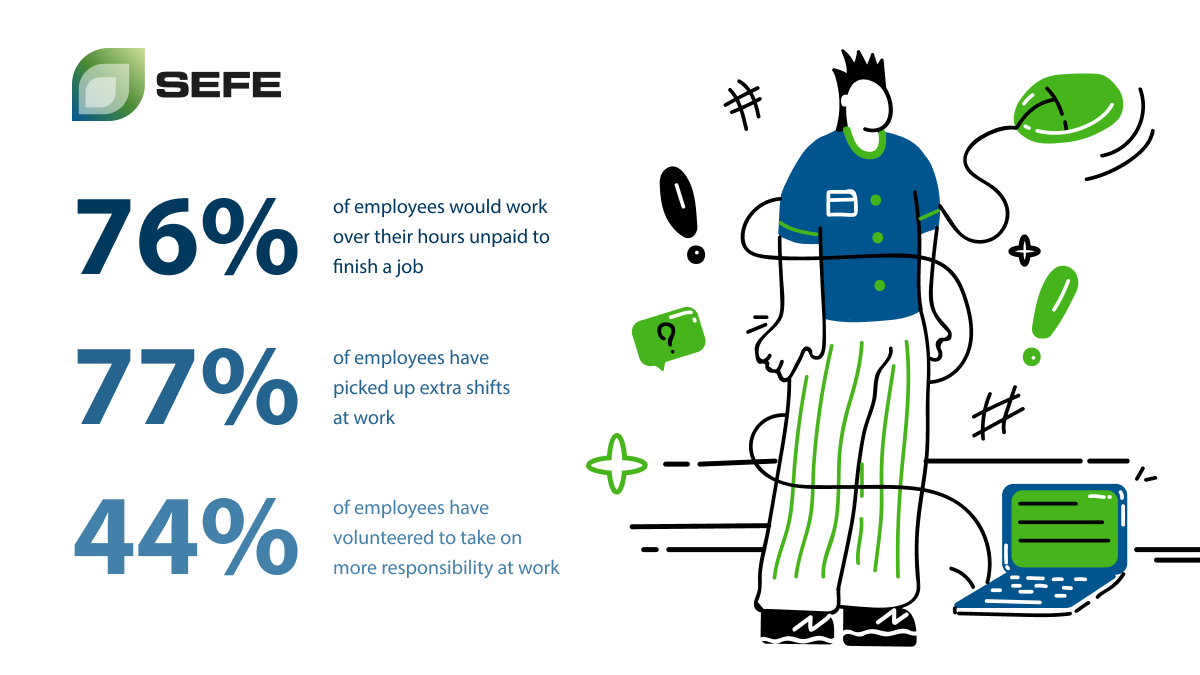
Overall, more than three-quarters of participants had picked up extra shifts at work. Those aged 65+ were least likely to have picked up extra shifts (67.9%), compared with 35-44-year-olds who were the most likely to add extra shifts into their schedule (83.5%). Participants aged 18-24 and 55-64 had very similar results, with around 73% of each picking up extra shifts.
Looking at the responses as a whole, it seems that there isn’t much difference in attitudes when it comes to picking up additional shifts either when asked or of your own accord.
Have you ever done overtime? And if so, were you paid?
We found that over half of our participants had worked paid overtime, compared to 12.8% who had worked unpaid overtime. The 18-24-year-old category was the only age range in which the majority of participants said that they had worked unpaid overtime, while all other age categories’ highest percentages were for working paid overtime. This could be contributing to lower work ethic since younger generations seem to be lacking fair compensation for their additional effort.
The 18-24-year-old category also had the highest percentage for not working overtime (33.3%), followed by the 65+ category (16.1%). 35-44-year-olds had the biggest percentage difference in terms of working paid and unpaid overtime – 59.8% vs 7.9%.
Would you ever work over your hours (unpaid) to finish a job?
53.3% of 18-24-year-olds were unwilling to work unpaid overtime to complete a job, while 80.4% of those aged 65 and above were willing to do so. This shows a significant difference in attitudes towards completing work within an allotted time frame.
However, over three-quarters of all participants said they would work over their hours without pay to finish a job, indicating a high work ethic across all age categories.
Have you ever volunteered to take on more responsibility at work?
When asked if they had ever volunteered to take on more responsibility, we found that close to three-quarters had done so. The over 65s category had the highest percentage of participants who had volunteered to take on more responsibility at work (78.6%), compared to the 18-24-year-old category which had the lowest percentage (60%), showing a significant difference in ways of working.
The results further showed that the older the participants get, the more likely they are to have volunteered to take on more responsibility at work.
If you answered ‘Yes’, were you financially compensated for this?
Of those who had voluntarily taken on more responsibility at work, almost half didn’t receive financial compensation for their extra efforts. 25-34-year-olds had the highest percentage of participants who had volunteered to take on more at work but weren’t given financial compensation for it.
Are you involved in any extra groups/teams at work (for example a charity group or diversity and inclusion group)?
Overall, 77.5% of participants weren’t involved in any extra groups or teams in their workplace. 18-24-year-olds were the most likely not to be involved in any extra groups or teams at work, with 86.7% of them choosing not to.
This could be because they’re more likely to have given their time for free in the past and are reluctant to do it again. It could also be due to the recent “quiet quitting” movement, which means that workers are only willing to be involved in the minimum duties required by their role. This wouldn’t include any extra teams, and so they’re unwilling to join in.
Have you ever felt stressed due to workload?
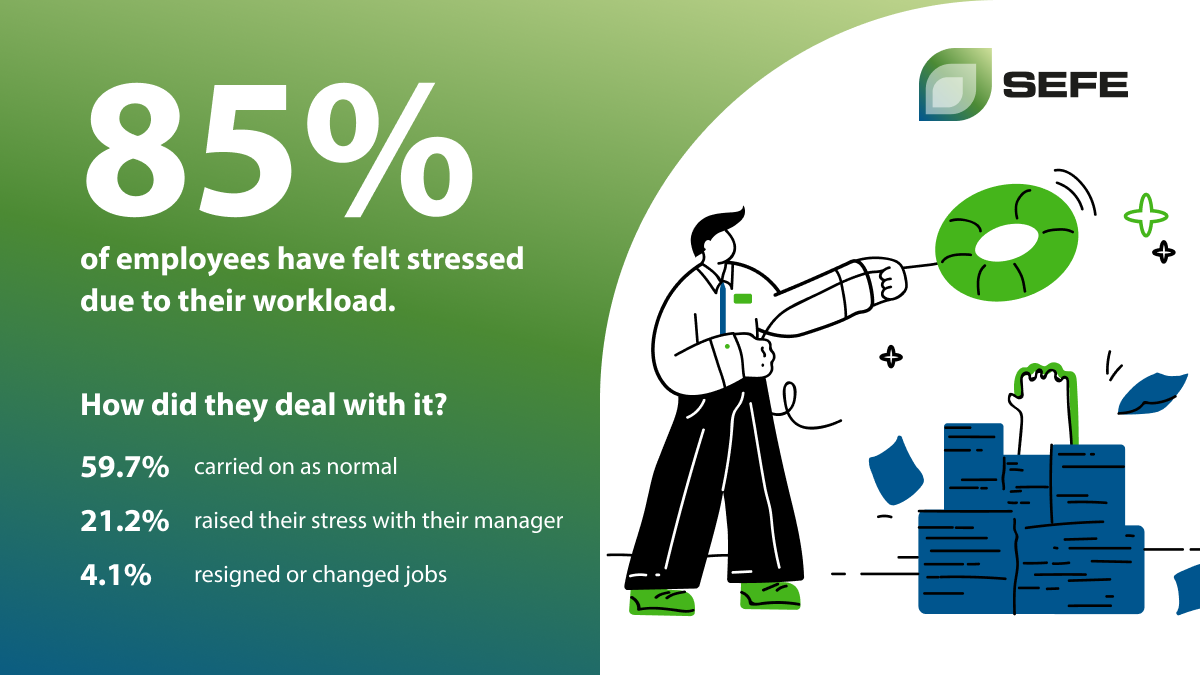
Nearly 85% of participants said that they had felt stressed at some point in their careers due to their workload. 73.2% of the participants aged 65+ had felt stressed due to work, making them the lowest percentage. This is compared to the 35-44 and 45-54-year-old categories who both came in at 89%.
If so, how have you handled this?
Of those who had felt stressed due to their workload, we then asked how they had handled it. Most participants (59.7%) said that they just carried on as normal, while over 1 in 5 raised their concerns with their manager. Quite a few participants (14.1%) also took things further by resigning or changing their jobs because they were stressed by their workload.
On a scale of 1 to 10, how important is your career in your life?
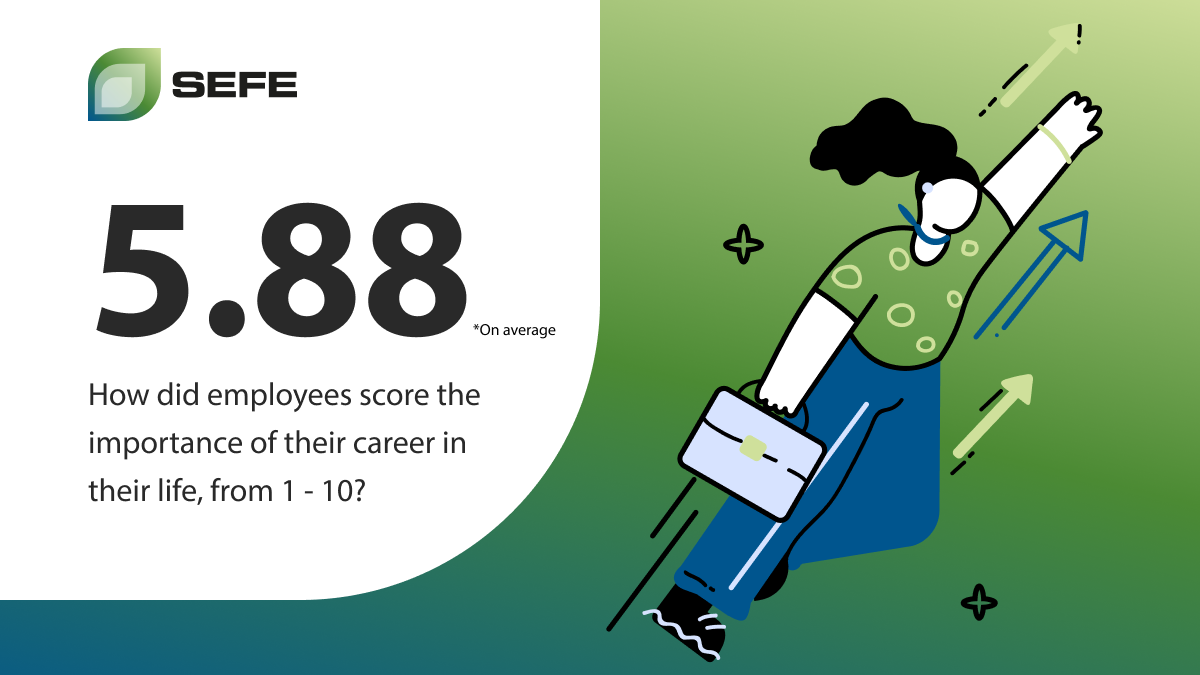
The average score was 5.88 when we asked our participants to rank how important their career is in their lives.
The study also found that the 65+ age group had the highest percentage (21.4%) of those who chose ‘1’ on a scale of 1 to 10 for how important their career is in their lives. This compared to the 35–44-year-old category, where just 4.7% voted ‘1’. Moreover, the 18-24-year-old category had the highest percentage (20%) of those who chose ‘10’ for how important their career is in their lives, compared to the 45-54-year-old category, where just 2.2% voted ‘10’. This suggests that careers are relatively important in many young people’s lives.
Does your attitude to work differ depending on the job you’re doing?
Overall, 70% of participants said that their attitude to work can change depending on the job they’re doing. Almost all of the participants in the 18-24 category (93.3%) said that their attitude to work differs depending on the job, compared to just 64% of 45-54-year-olds.
How much effort would you say you put into your job each day?
When asked how much effort they say they put into their job daily, the majority of our participants (51.8%) said that they put in enough effort to do their jobs well. This was followed by 29.5% of participants who said they put in all their effort. Only 2.1% responded that they put no effort into their job.
25-34-year-olds had the highest percentage of participants who said that they put in all of their effort at their jobs each day. This could be because people in this age category are most likely to be making big decisions in their lives that could be impacted by doing well at work. Seeking promotions and looking to climb the ladder requires effort at this point of their career that could help with buying a house or starting a family.
Would you find it easy to quit your job?
Over half of the participants said they wouldn’t find it easy to quit their jobs. Perhaps unsurprisingly, the 65+ age category is the only one where the majority would find it easy to quit, with almost 65% answering yes to this question. On the other hand, the 25-34-year-old category had the highest percentage of participants who wouldn’t find it easy to quit their job, with over 63% responding with no.
Do you care about what your manager thinks of your work?
More than 4 in 5 participants said that they care what their manager thinks of their work. However, the 55-64-year-old category appears to care the most, with over 87% saying that they care. In contrast, far fewer of those in the lowest age category (18-24) said that they care what their manager thinks, which could be because of changing attitudes in the younger generations. Although the youngest age category had the lowest percentage of participants who cared what their managers thought, the percentage is still relatively high at just over 73%.
How would you deal with making a mistake at work?
When it comes to making mistakes at work, the majority of our participants (36.4%) said they would own up directly to the affected person if they realised they’d done something wrong. The second most common way that our participants said they would deal with mistakes is to find a way to fix the problem, with just over 1 in 3 stating this.
Very few would go down the route of lying about making the mistake (0.8%) or making excuses (0.9%).
What is your biggest motivation at work?
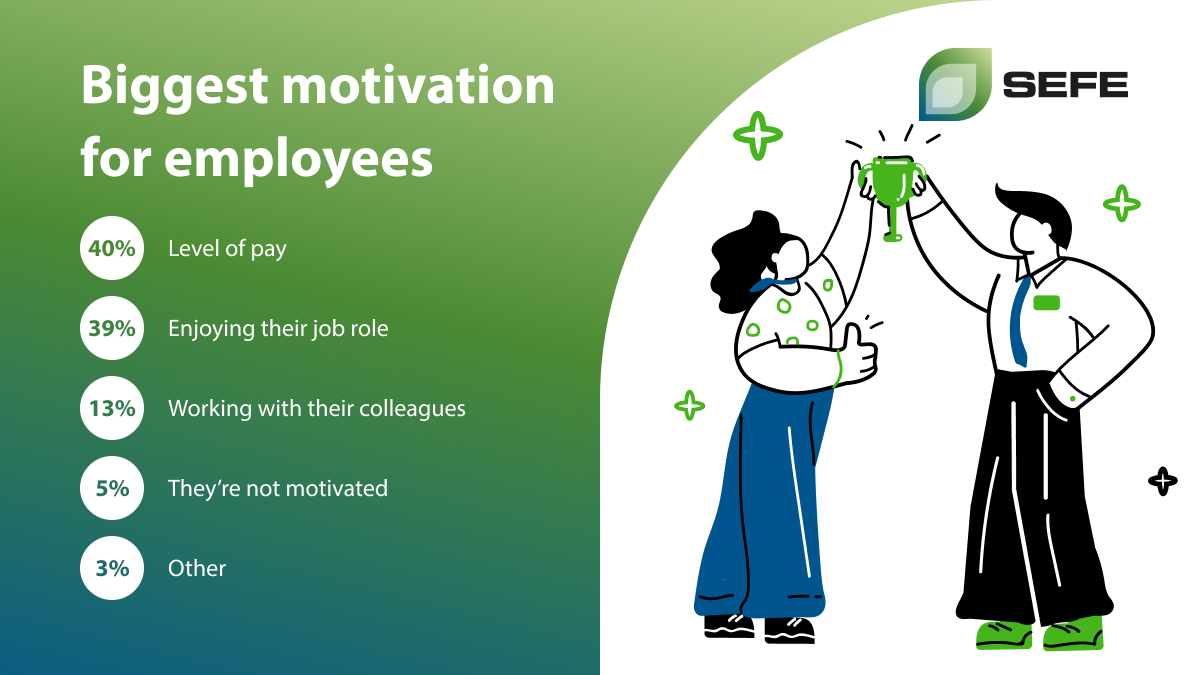
The majority of participants (40.2%) claimed that their biggest motivation at work is money. But when we took a closer look, we discovered that those in the three youngest age categories (18-24, 25-34 and 35-44) all chose pay above other motivators.
Meanwhile, of the 38.5% who said that job enjoyment motivates them the most, the majority were from the three oldest age categories (45-54, 55-64 and 65+). This could mean that as the workforce ages, their motivations and priorities shift. Job enjoyment becomes more important as people mature and reach the later stages of their careers, whereas money is the driving force at the beginning.
Finally, a small number of participants (5%) responded that they had no motivation at work. A lack of motivation could be a major driving force for a low work ethic and might indicate that they aren’t satisfied with the job itself or the pay.
To find out more about careers at SEFE Marketing & Trading please visit our homepage.
The views, opinions and positions expressed within this article are those of our third-party content providers alone and do not represent those of SEFE Marketing & Trading. The accuracy, completeness and validity of any statements made within this article are not guaranteed. SEFE Marketing & Trading accepts no liability for any errors, omissions or representations.